Figure 2 summarizes the screening and study selection process. We identified 17,048 citations for title and abstract screening and we reviewed the full-text of 449 studies. Seventy-three RCTs (n = 1061) met inclusion criteria, which we pooled [references provided in Supplemental Table 2]. Supplemental Table 2 summarizes the characteristics of the included studies. These trials were all placebo-controlled, single-centre, and examined nitrate-containing substances in a total of 1061 participants undergoing various endurance-based exercise tests. The participants ranged from sedentary to elite athletes in their level of athletic involvement, with the majority of participants characterized as recreationally active, healthy adults. The trials reported power output (28 studies), time to exhaustion (20 studies), rating of perceived exertion (20 studies), time trial performance (28 studies), distance travelled (2 studies), work done (4 studies), VO2 (42 studies), VO2max (10 studies), and blood lactate (23 studies).
Three trials were at low risk of bias, while the remaining trials were at high risk of bias due to unclear descriptions of random sequence generation and/or allocation concealment. Table 1 presents the quality of evidence assessment for each outcome.
Power output (Fig. 3)
Nitrates led to an increase in power output compared placebo (MD 4.59 watts, 95% CI [2.6, 6.58], 95%CI, P < 0.0001, I2 = 0%, low-quality evidence). We downgraded the quality of evidence for serious risk of bias and suspected publication bias (Table 1).
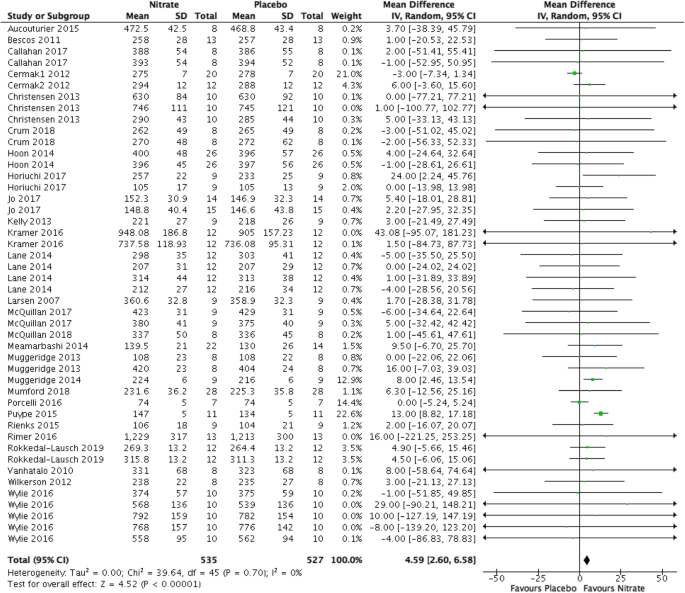
Forest plot for power output in watts for nitrate supplementation versus placebo. Square markers represent mean difference for individual studies, with square size proportional to the weight given to each study in the meta-analysis. Horizontal lines indicate 95% confidence intervals (CI). The solid diamond represents the estimated 95% confidence interval for effect size of all meta-analyzed data
Time to exhaustion (Fig. 4)
Nitrates increased the time to exhaustion compared to placebo (MD 25.27 s, 95% CI [12.69, 37.84], P < 0.00001, I2 = 38%, low-quality evidence). We downgraded the quality of evidence for serious risk of bias and suspected publication bias (Table 1).
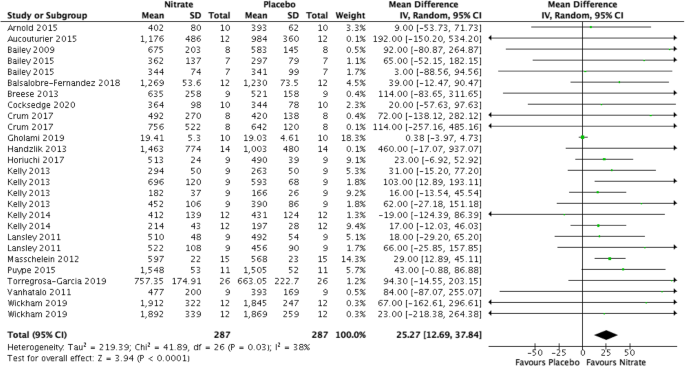
Forest plot for time to exhaustion in seconds for nitrate supplementation versus placebo. Square markers represent mean difference for individual studies, with square size proportional to the weight given to each study in the meta-analysis. Horizontal lines indicate 95% confidence intervals (CI). The solid diamond represents the estimated 95% confidence interval for effect size of all meta-analyzed data
Distance travelled (Fig. 5)
Participants in the nitrate group had a travelled 163.7 m further compared to participants in the placebo group (MD 163.73 m, 95% CI [18.4, 309.1], P = 0.03, I2 = 0%, very low-quality evidence). We downgraded the quality of evidence for serious risk of bias and very serious imprecision (Table 1).
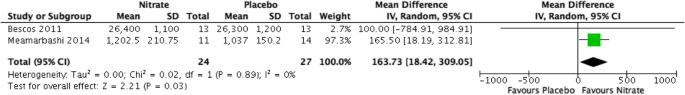
Forest plot for distance travelled in metres for nitrate supplementation versus placebo. Square markers represent mean difference for individual studies, with square size proportional to the weight given to each study in the meta-analysis. Horizontal lines indicate 95% confidence intervals (CI). The solid diamond represents the estimated 95% confidence interval for effect size of all meta-analyzed data
VO2 (Fig. 6)
Participants in the nitrate group had a significant decrease in VO2 compared to participants in the placebo group (MD − 0.04 L/min, 95% CI [− 0.05, − 0.02], P < 0.0001, I2 = 0%, low-quality evidence). We downgraded the quality of evidence for serious risk of bias and serious indirectness (Table 1).
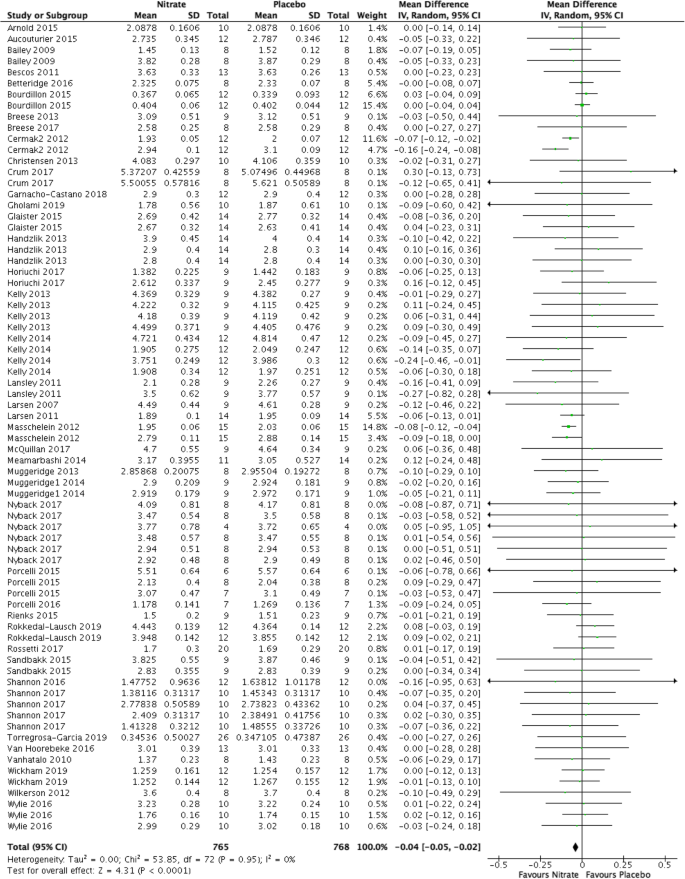
Forest plot for VO2 in litres/minute for nitrate supplementation versus placebo. Square markers represent mean difference for individual studies, with square size proportional to the weight given to each study in the meta-analysis. Horizontal lines indicate 95% confidence intervals (CI). The solid diamond represents the estimated 95% confidence interval for effect size of all meta-analyzed data
VO2max (Fig. 7)
Nitrates did not increase VO2max compared with placebo (MD 0.04 L/min, 95% CI [− 0.02, 0.10], P = 0.23, I2 = 0%, very low-quality evidence). We downgraded the quality of evidence for serious risk of bias, serious indirectness, and serious imprecision (Table 1).
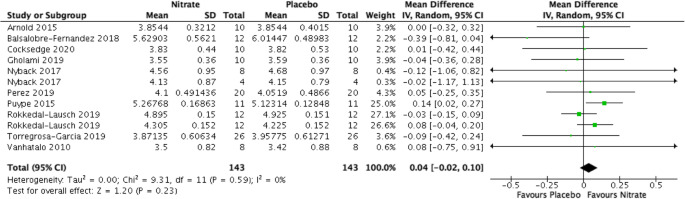
Forest plot for VO2max in litres/minute in kilojoules for nitrate supplementation versus placebo. Square markers represent mean difference for individual studies, with square size proportional to the weight given to each study in the meta-analysis. Horizontal lines indicate 95% confidence intervals (CI). The solid diamond represents the estimated 95% confidence interval for effect size of all meta-analyzed data
Rating of perceived exertion (Supplemental Fig. 1)
Nitrates did not affect the rating of perceived exertion (Borg scale) (MD -0.11, 95% CI [− 0.34, 0.12], P = 0.36, I2 = 62%, very low-quality evidence). We downgraded the quality of evidence for serious risk of bias, serious inconsistency, and serious imprecision (Table 1).
Time trial performance (Supplemental Fig. 2)
Time trials appeared unchanged with and without nitrates (MD − 1.98 s, 95% CI [− 4.37, 0.41], P = 0.1, I2 = 8%, low-quality evidence). We downgraded the quality of evidence for serious risk of bias and serious imprecision (Table 1).
Work done (Supplemental Fig. 3)
Nitrates did not significantly increase work done compared with placebo (MD 0.02 kJ, 95% CI [0.0, 0.03], p = 0.09, I2 = 0%, low-quality evidence). We downgraded the quality of evidence for serious risk of bias and serious inconsistency (Table 1).
Blood lactate (Supplemental Fig. 4)
Nitrates did not significantly decrease blood lactate compared with placebo (MD − 0.08 mM, 95%CI [− 0.21, 0.05], P = 0.22, I2 = 12%, very low-quality evidence). We downgraded the quality of evidence for serious risk of bias, serious indirectness, serious imprecision, and suspected publication bias (Table 1).
Subgroup analyses
We attempted to perform subgroup analyses according to the length of dosing, athletic level, source of dietary nitrate, mean age profile, co-supplementation, and risk of bias. The available data were insufficient to perform subgroup analyses based on the daily dose of nitrate. We identified only one statistically interaction – an interaction (p = 0.005) between athletic level and treatment on VO2, with no significant effect of nitrate supplementation in elite (MD 0.01, 95% CI [− 0.02, 0.04]) or sedentary athletes (MD 0.06, 95% CI [− 0.16, 0.29]), but a significant effect in recreational athletes (MD -0.05, 95% CI [− 0.07, − 0.03]) (Supplemental Figure 5).
Source link